Welcome to Hilltop
“I am close to everything that is important to me and my kids have so many friends in the neighborhood that playdates are easy.”
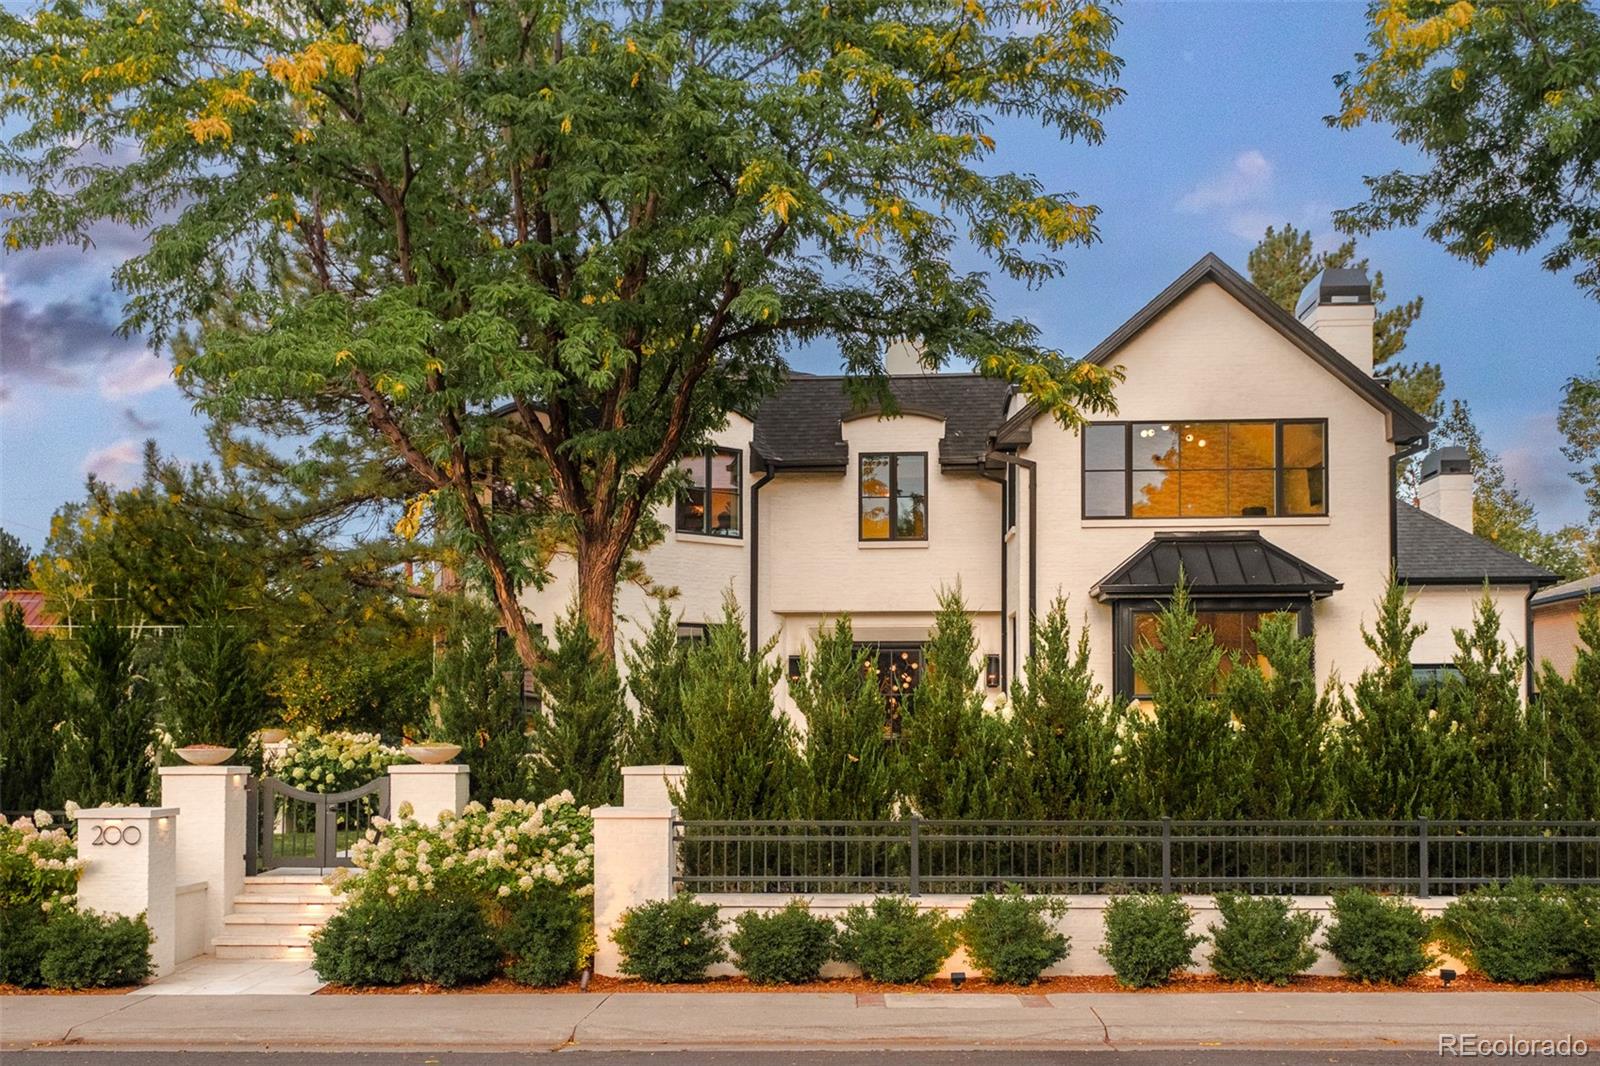
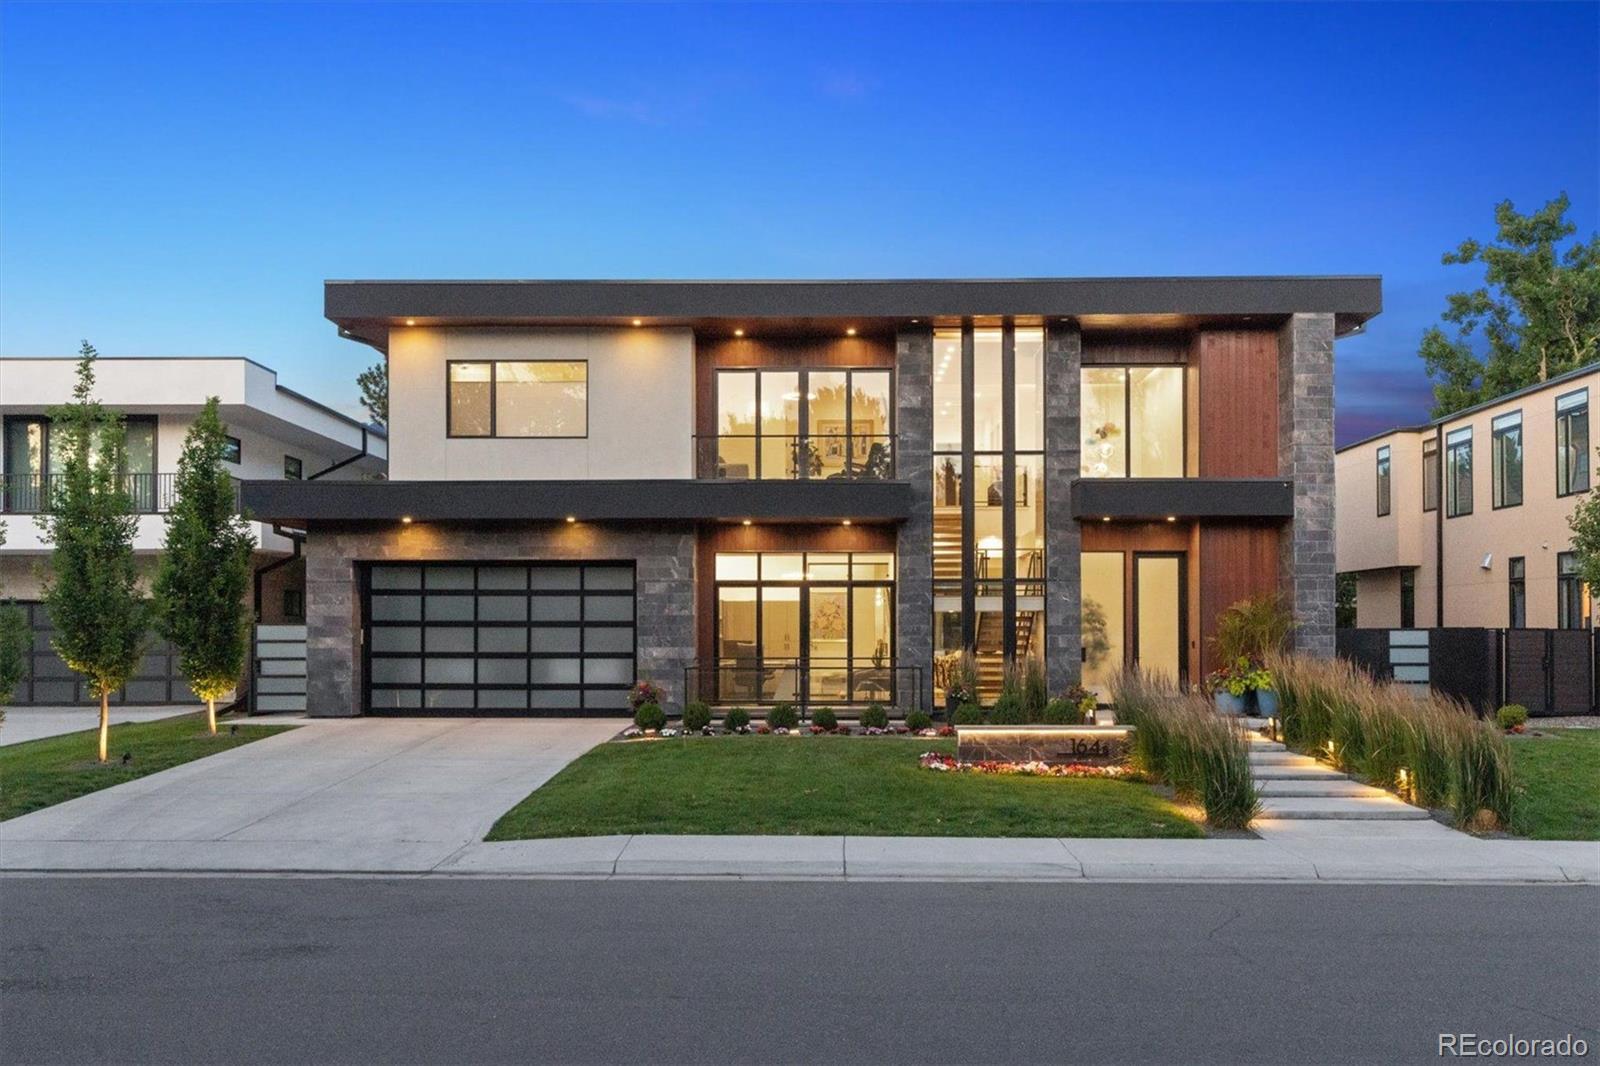
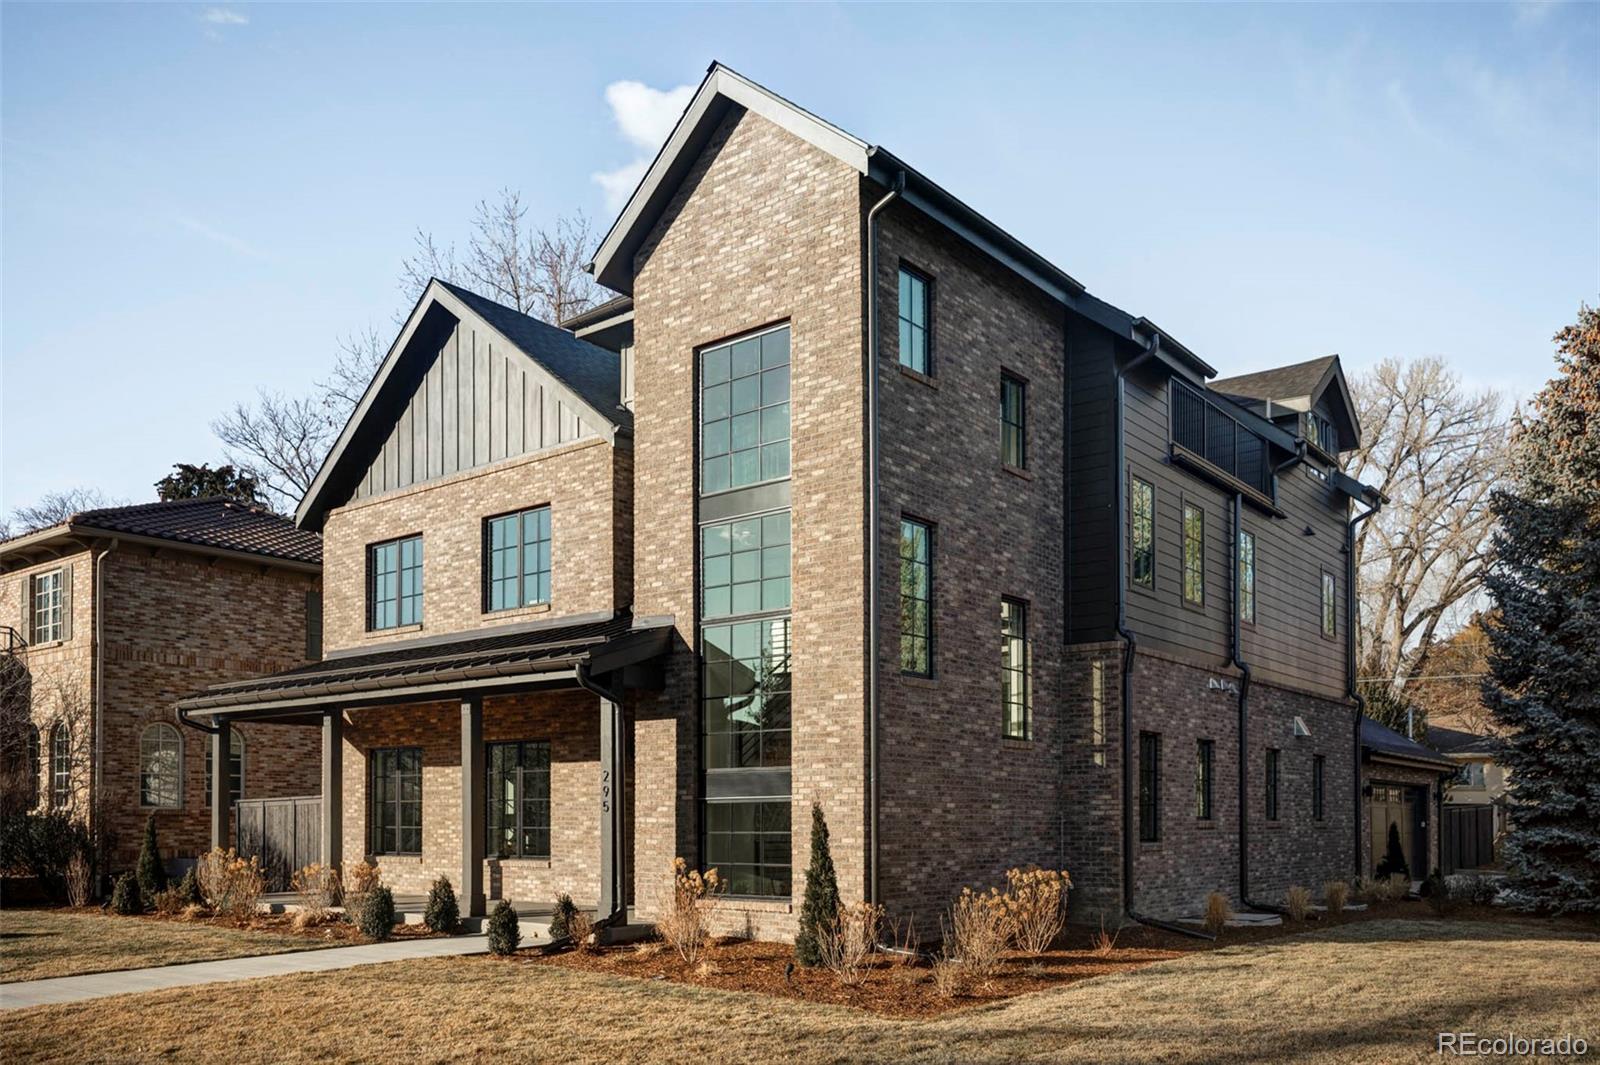
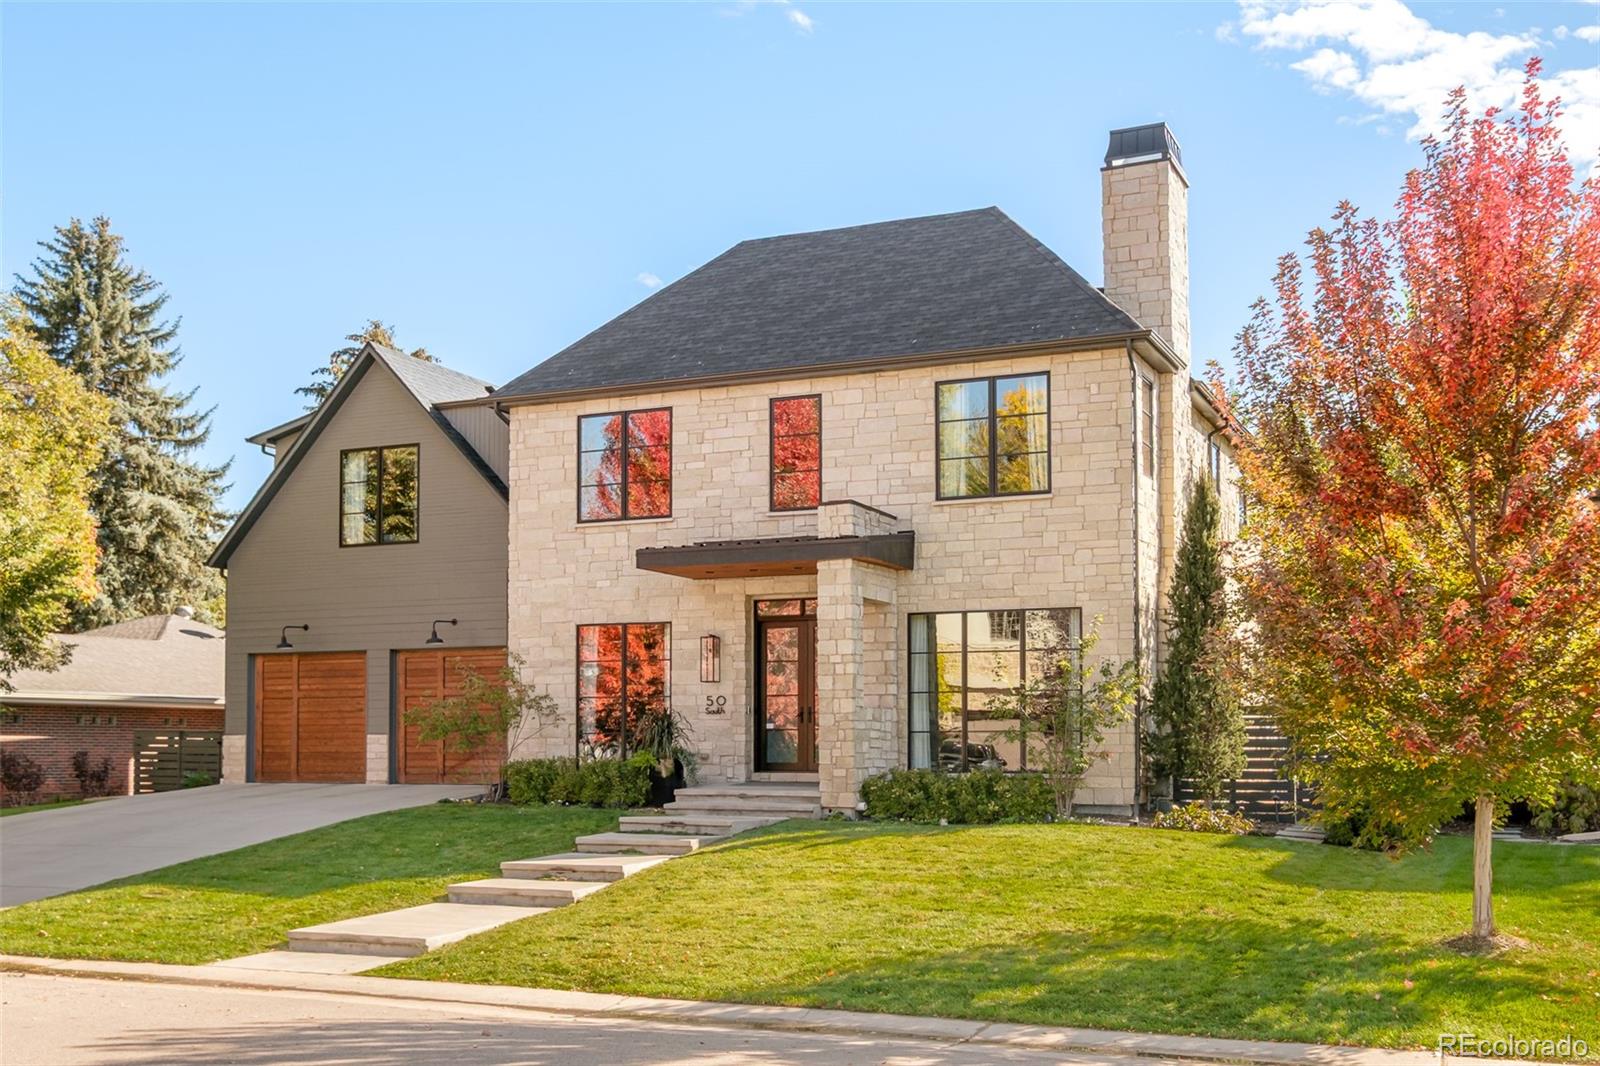
Hilltop is a wonderful mix of old and new, with exquisite Tudors and Cottages mixed with ultra-modern new-build masterpieces. Residents are drawn to Hilltop for its exquisite homes, Rocky Mountain views, and some of the best public schools in Denver, and convenient location just east of all the Cherry Creek buzz.
Market Trends
| Average Sales Price in 2024 | $2,299,213 | 10.74% increase vs. 2023 |
|---|---|---|
| Average Days on Market in 2024 | 44 | 37.50% increase vs. 2023 |
| Homes Sold in 2024 | 60 | 9.09% decrease vs. 2023 |
Don’t Miss
- Saturday Afternoons in Robinson Park, Cranmer Park, & Crestmoor Park
- Mountain Views
- Basil Doc’s Pizzeria
- Park Burger
- High Point Creamery
- Jewish Community Center for Pool, Tennis, Preschool & Summer Camps
- Chook for Charcoal Chicken and More
- 9th & Colorado AMC Theatre
- Frank & Roze Coffee Company
- Santiago’s for the Best Breakfast Burrito
- Snooze for Brunch
- The Rotary
Local Schools
- Private Schools
- Carson Elementary (K-5)
- Steck Elementary (K-5)
- Hill Middle School (6-8)
- George Washington High School (9-12)


